

Student responses following off of Stefanie Posavec and Giorgia Lupi’s brilliant Dear Data Project for my Fall 2018 Visual Communication Course. (The 2016 version of the course is detailed in full here.)
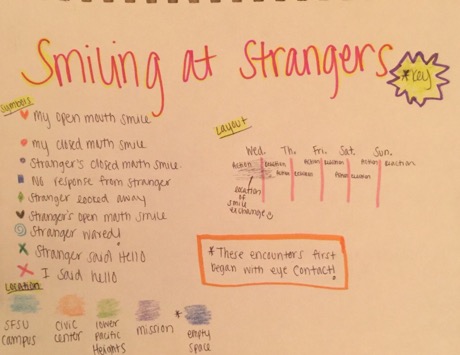

Alexis A: I really enjoyed this project! I liked making my data into something colorful and engaging. Recording the data was probably the most fun. I spent five days smiling at people, woohoo! I found that when I got a smile back, I became more excited to smile at people throughout the day. The most common response was a smile back and I am glad because I was not expecting that. Most of my data was collected on campus but some was collected in other parts of the City. I really tried to make an actual connection to all the people I smiled at, so I knew that when they did not smile back it was not because “they didn’t see me.” I’ll have to admit when the strangers did not respond or when they looked away, I got my feelings hurt. However, when someone smiled at me first, waved, or even said hello I became so happy and my faith in humanity was restored. Experiencing that kind of kindness made my day 50x better. This was so much fun, I am now trying to smile at strangers everywhere I go.
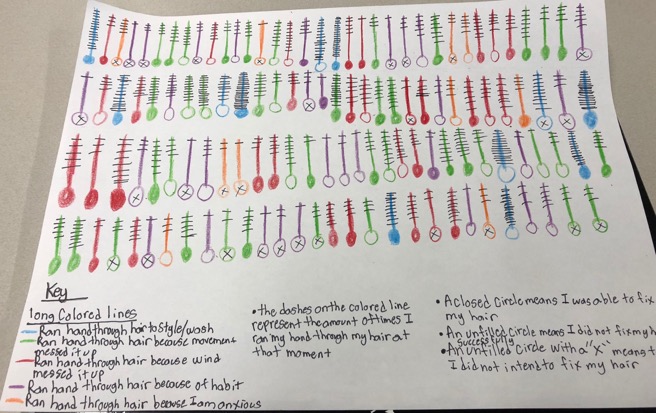
Erik: I tracked the amount of times that I run my hand through my hair. I took into consideration why I was running my hand through my hair and the amount of times I ran my hand through my hair in each moment. It was really interesting to see my data on paper because I was able to tell what time of the day it was simply by seeing the reason that I ran my hand through my hair. For example when I was washing/styling my hair it was typically morning if the circle was filled or night if the circle on the blue line was empty. It is also very interesting that in a week I ran my hand through my hair a total of 123 times approximately. I was astonished to see that I unconsciously do this very often. This was a very enjoyable project that I want to continue to do with other aspects of my life.
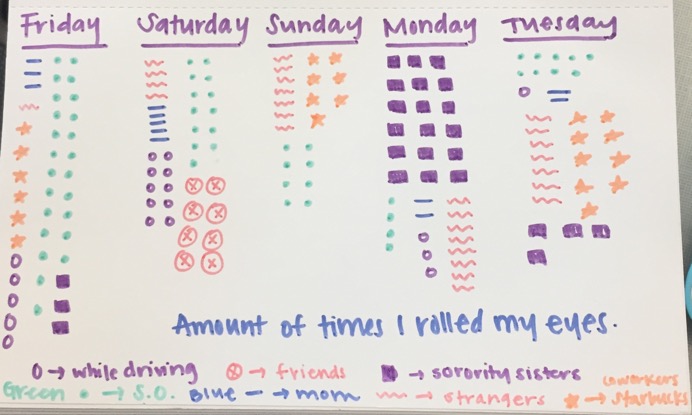
Alyssa: For this assignment, I tracked the amount of times I rolled my eyes. When I started on Friday, I realized how many times I do this on a daily basis. Throughout tracking the data, someone pointed out to me that I probably should have tracked three different scenarios because it makes it seem like I just have a lot of attitude. I also caught myself trying to not roll my eyes because I didn’t want to have to mark it down. Friday: 42 Saturday: 40 Sunday: 22 Monday: 35 Tuesday: 32. I slowly, but surely started to get better at this, but I think because it was more of a conscious decision. I think there was a correlation to me being stressed is when I did it the most. I really enjoyed this project!
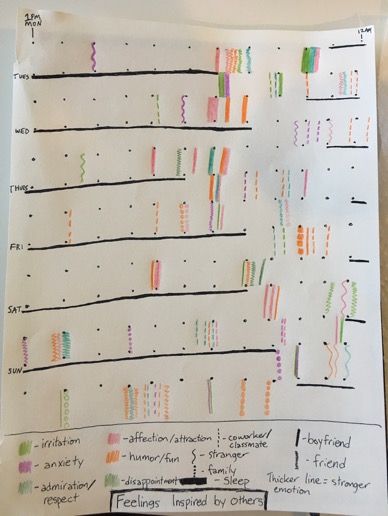
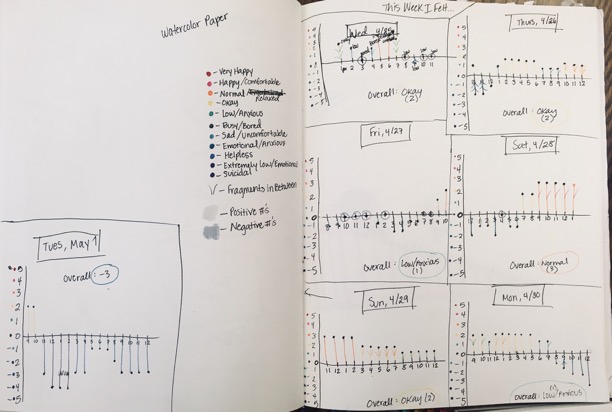
Emily F: I decided to do my project on feelings I have that are a response to other people. I wanted to do this because I think sometimes I have emotional reactions to things people say and do that I don’t fully understand or aren’t rational. I paid attention to strong feelings but there are definitely mini feelings throughout the day that I haven’t documented. I looked at my reactions to my close relationships (my boyfriend, friends, and family) but also other people (my coworkers, classmates, and strangers). The feelings I noticed were affection/attraction, respect/admiration, disappointment, anxiety, irritation/frustration, and humor/fun. Each dot represents an hour of the day, so it’s like a calendar of hours from 1pm Monday to 12am Sunday. I’ve noticed that the middle of my days tend to be more isolated and so I don’t have much data on the left side of the visual. Also I assumed that most mornings I’d be irritated or anxious at my boyfriend but some days I felt affection or humor. I was surprised because I’m very much not a morning person.

Gina: This activity encouraged me to become aware of where I was, how I got from place to place, and of the routine we so easily fall into. I felt I noticed more when I thought about where I was and how familiar I felt in certain places. I was catsitting in a place I have never spent time in so it felt unfamiliar to me, but that is when I noticed more. The more familiar I was with certain areas, the less I noticed in my surroundings.
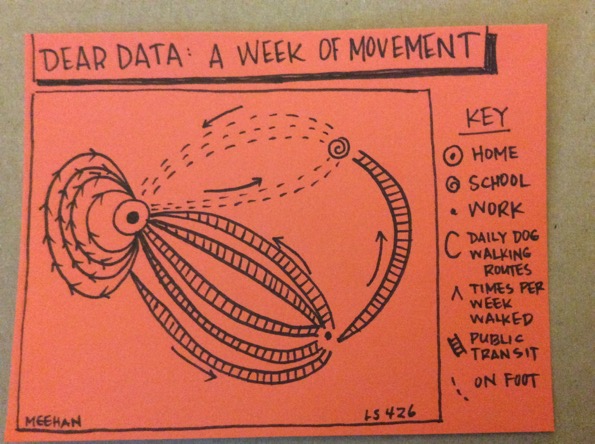
Audrey: I tracked all of the locations that I went to in a week and which methods of transportation I used to get there. Each line of track and dotted line represents one trip, while each of the circles around my house represents the times of day that my dog goes for a walk and each caret represents me taking her on the walk.
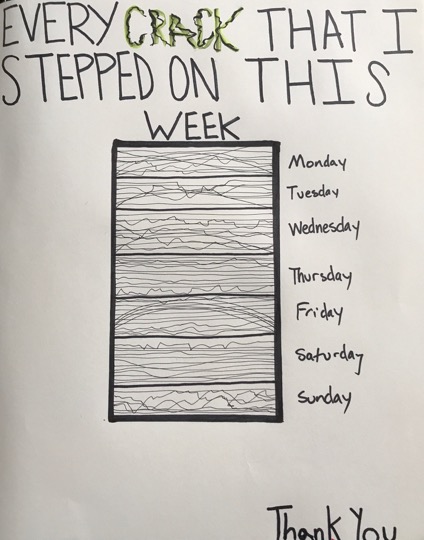
DJ: Here is every crack I stepped on this week (up until now on Sunday). I hate stepping on cracks and as a result I do it minimally. I would take photos of every crack I stepped on and would draw them all at the end of the day. The photos took up a lot of spaces so I would delete them after each day, but I saved today’s so far as proof.
Nicole
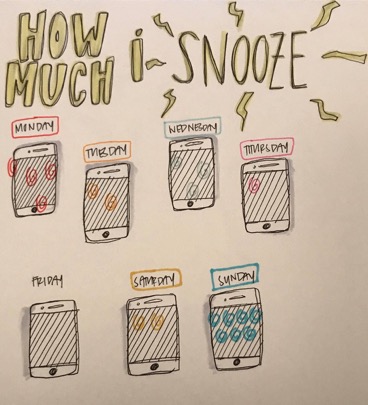
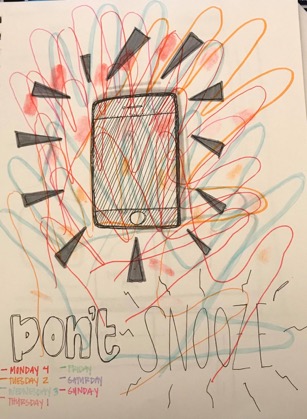
Janna: I decided to track how much I hit the snooze button on my phone each morning for a week. I started to collect my data by tracing my hand the same amount of times that I had snoozed in the morning. This method started to become messy so I reconfigured my data-drawing method by drawing 7 iphones to represent each day of the week and drawing spirals that “look” like thumbprints; the amount of spirals drawing represents the amount of times I had pressed snooze.
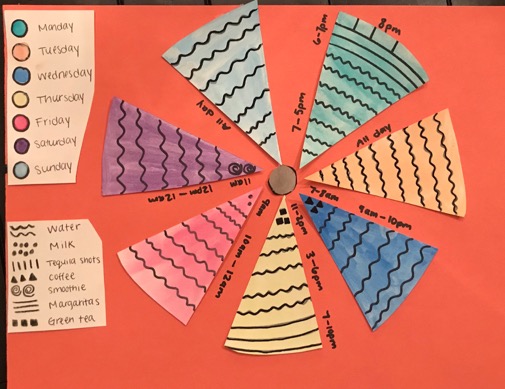
Karina: I did my data project on all the things I drank every day for 7 days. The days are color coordinated in order of the circle. The different symbols represent the different things I drank. However many appear in their section is how much I drank. For example if there is 7 squiggly lines then I drank 7 glasses of water. What I drank is also documented in the order of when i drank it. Like Monday I started off with water and rank only water until about 6pm and ended the night with margaritas and shots.
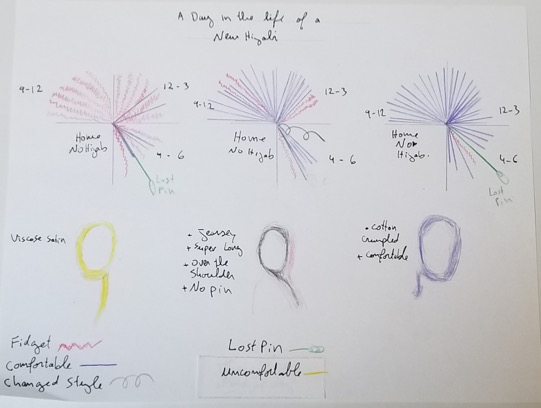
Nora: “A Day in the Life of a New Hijabi” I tired to draw the 3 styles i wore. “Hijabi” means a woman that wear hijab, or head covering. I’ve only been wearing my hijab for less than a year, so I’m still learning what style fits me, what fabrics there are, and to stay comfortable all day. I based my finding on wearing 3 of scarves of different fabrics: Viscose satin, crumpled cotton, and jersey. All scarves are different in length and comfort (depending on the day).
I found that the viscose satin was such a pain to wear throughout the day. I think it’s because of the length and and how slippery it is. I kept fidgeting with it every couple of minutes. The crumpled cotton hijab was the most comfortable, I did fidget a bit and lost my pin, but the fabric makes it easy to manage without one. The jersey hijab is very comfortable, and doesn’t require a safety pin to secure it, but it’s super long! it weighed down on one side and I had to change the style a few times throughout the day. I was a bit hesitant to choose my hijabs as the data subject, because I feel it may sound like I am complaining. I’m not! I’m just trying to figure out what style and fabric works well with me. Choosing to wear the hijab has changed my mood immensely for the better and has given me confidence!

Marissa
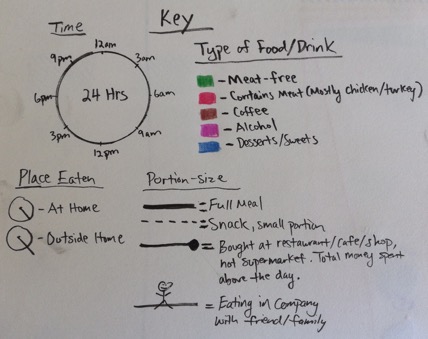
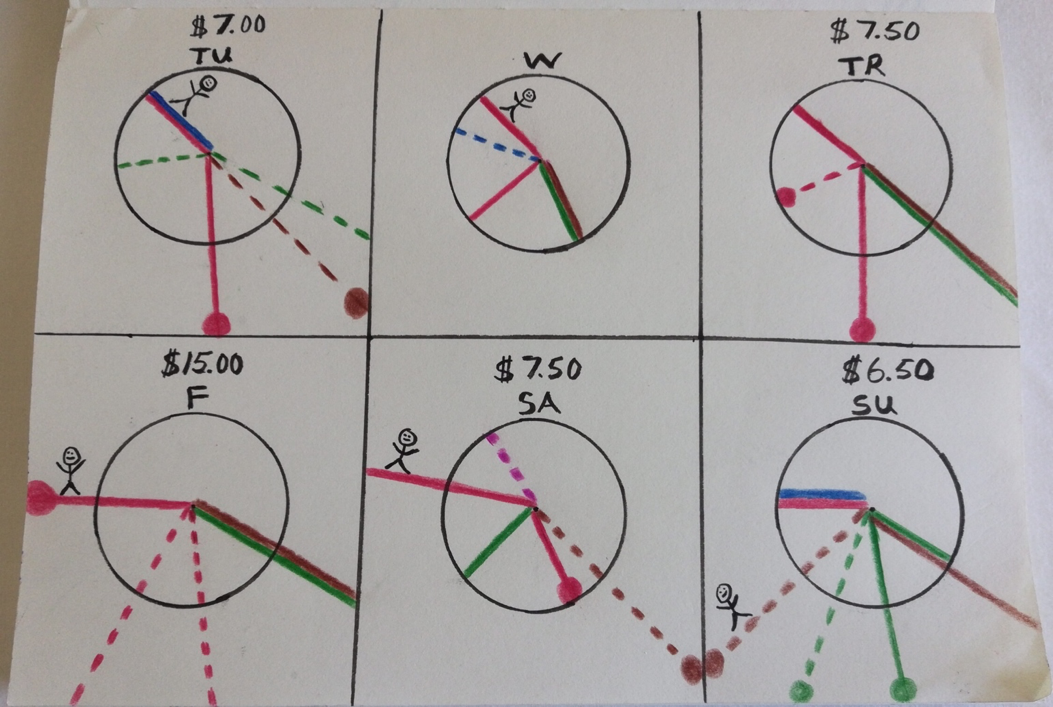
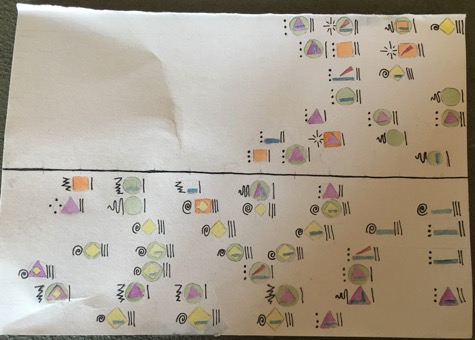
Brian: I tracked everything I ate and drank for six days (excluding gum & really tiny portions like samples from TJs). I extracted eight categories from the data. 1) Meat consumption. 2) Homemade-ness. 3) Portion size. 4) Total meals & duration between meals. 5) Projected cost of food purchased outside of supermarkets. 6) The type of food/drink. 7) Place eaten. 8) Meals with company. I probably could have added more data categories but I think eight should suffice for now. The project allowed me to see data in a creative light and revealed some things about myself which I probably wouldn’t have been conscious of if I didn’t embark on this project. I am, for example, pretty consistent with the number of portions I eat in a day (4) and in the time in which I eat them. I also tend to eat in the company of others in the evening rather than in the morning or afternoon. I guess I have a busy schedule!
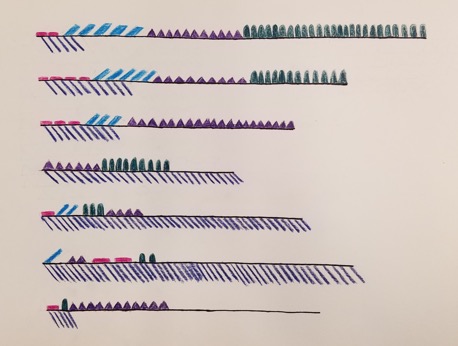
Anthony: I usually take the same routes walking or riding my bicycle around the city and at school. But being in the midst of this project allowed me to see more of my surroundings, while trying to spot birds. In addition, I realized after the project that my neighborhood has many pigeons, while I could not spot one on campus. This got me thinking about where in the city birds call their home, with possible reasons being a nearby foods source, shelter, and safety from other predators. After my data was collected, visualizing the numbers was the biggest challenge for me (I wanted the visualization to resemble birds feathers), and I decided to settle with a simple way of showing the data collected.
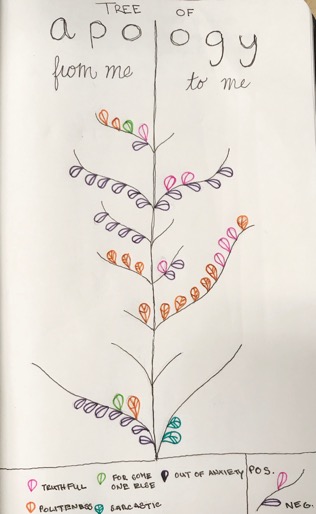
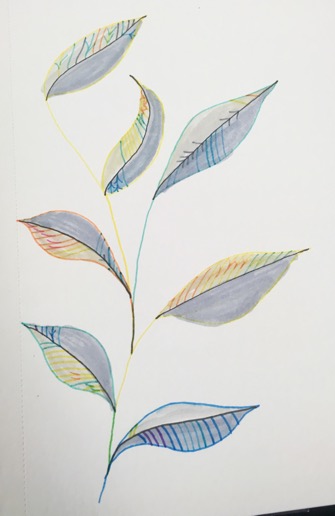
Ashley: My boyfriend notices that I over apologize (and can be quite irksome for him) so I began not only tracking the number of times I have apologized and what kind of apology it was but also how many people apologized to me throughout the day. I think sorries can be positive and negative. I’m an anxious person so a lot of the time I apologize out of anxiety or unnecessary guilt which isn’t healthy for me or my self-esteem. Another negative apology would be a sarcastic one. The words ”I’m sorry” come out but are not meant. The negative leaves are on the bottom of the branches. Most other apologies are positive and are on the top parts of the branches.
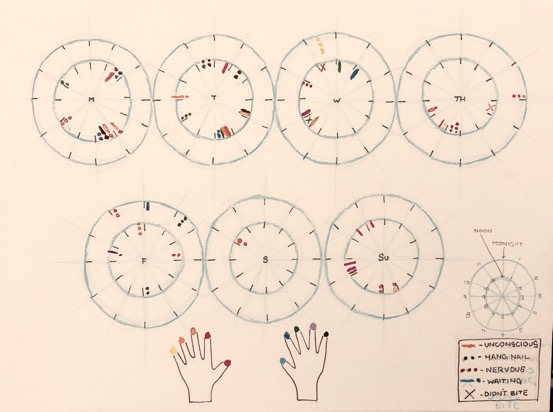
Jason: I kept track (or tried to)of my nail biting habits and exactly how I am affected by it. I kept a record each time I bit a finger nail, which nail it was, one of the four categorizations for my emotions, and at what time I was biting them. The most interesting thing about doing this is how I started to realize that I bite my nails unconsciously, and every time I realized, it would leave me trying my best to avoid biting my nails again. Some of the days toward the end of the week, I started carrying finger nail clippers regularly and that’s why my nail biting was limited. I enjoy the final draft of this data set, as it looks almost like Petri dishes that you observe bacteria in. Also, I left most of each clock in non-photo blue because I wanted to be able to scan in my drawings and look at them as a more abstract design.